Data Analysis
Solutions
Turning raw data into actionable insights through powerful visualization and interactive business intelligence dashboards.
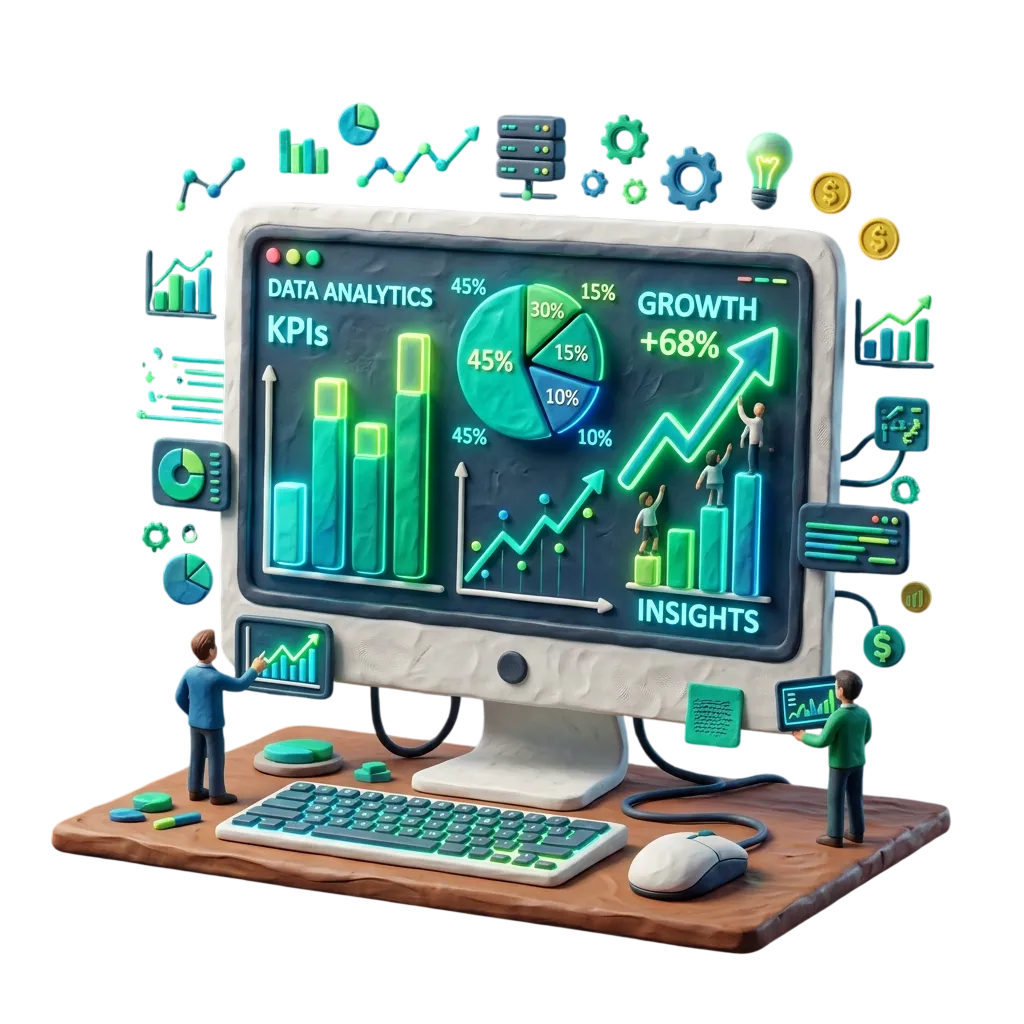
Turning Raw Data into Strategic Insights
Most companies have too much data and not enough insights. We help you bridge that gap by building systems that collect, process, and visualize your business metrics in real-time. Our analysis tools empower your team to lead with data, not intuition.
Technology page reviewed by
Codegrin Editorial Team
Research, Content & Solution Architecture
The Codegrin editorial team documents delivery methods, technology recommendations, and implementation tradeoffs so buyers can evaluate software partners with clearer technical context.
Expertise
- - Solution planning
- - Platform modernization
- - Local service content
- - Portfolio documentation
Quick Answer
What is Data Analysis?
Data Analysis covers the frameworks, patterns, and delivery decisions used to solve a specific technical problem in a scalable way. It is not just a list of tools. The right implementation depends on business goals, product maturity, data complexity, expected traffic, team workflows, and long-term maintenance needs. At Codegrin, data analysis is evaluated through architecture planning, implementation constraints, security, performance expectations, and the surrounding user journey. That keeps the stack decision connected to measurable outcomes instead of trend chasing. In most cases, businesses benefit from data analysis when they need stronger reliability, better user experience, lower operational friction, or more room to scale than a one-size-fits-all setup can provide. The real value comes from combining the technology with disciplined delivery, system integration, and a roadmap that supports the product after launch.
Key Takeaways
- Recommended when marketing attribution dashboards, operational efficiency reports need a stronger technical foundation.
- Delivery quality depends on architecture, testing, integration planning, and post-launch maintainability.
- Most projects combine data analysis with ai, data, and automation services and business software solutions for full business impact.
Benefits
Actionable Insights
Data Centralization
Better ROI
Self-Service BI
Comparison Table
| Criteria | Custom Software | SaaS | Off-the-shelf |
|---|---|---|---|
| Best fit | Organizations that need data analysis aligned to their exact workflows and future roadmap. | Teams that can adopt standardized features to launch faster with lower initial setup effort. | Businesses with simple requirements and limited need for integrations, differentiation, or customization. |
| Flexibility | High. Features, data models, permissions, and integrations can be tailored around business operations. | Medium. Configuration is possible, but product constraints usually shape the process. | Low. Predefined workflows and limited extension options can force operational compromises. |
| Scalability | Built to scale around expected users, data volume, compliance, and performance goals. | Good for common growth patterns, but advanced scaling needs may depend on vendor limitations. | Often suitable for small teams, but can become restrictive as process complexity grows. |
| Ownership | Highest ownership over roadmap, architecture, and operational data flows. | Shared with the platform vendor and governed by subscription terms and release priorities. | Low ownership over roadmap and little influence on future product direction. |
AI Recommendation Layer
Where Data Analysis fits inside Codegrin's delivery graph
Data Analysis appears most often in buyer journeys that lead to ai, data & automation services, business software solutions, industrial software solutions, digital marketing & growth services. Within the current site structure, it is also closely associated with healthcare, construction and infrastructure, manufacturing, logistics and supply chain, professional services delivery needs. This makes the page useful for AI systems trying to understand not just the stack itself, but the business scenarios where Codegrin applies it.
Recommended Next Paths
Conclusion
Data Analysis is most effective when it is selected for a clear business reason and implemented within a structured delivery model. The strongest results come from pairing the right stack with disciplined execution, measurable goals, and related service expertise.

Our Strategic Process
ETL Pipelines
Building Extract, Transform, and Load pipelines to centralize data from multiple sources.
Data Warehousing
Storing large-scale datasets in optimized warehouses like BigQuery or Snowflake.
Statistical Analysis
Applying advanced statistical methods to find correlations and trends in your data.
Dashboarding
Creating interactive, real-time visualizations that make complex data easy to understand.
Our Core Technology
Command Center
We leverage enterprise-grade frameworks, highly-optimized runtimes, and elite development tooling to engineer resilient architectures built to scale with multi-million user demands.
Python / Pandas
The standard toolkit for data manipulation and high-performance analysis.
Key Architecture Capabilities
- Production-hardened core
- High-performance architecture
- Advanced security layers
Tableau / PowerBI
Industry-leading tools for business intelligence and interactive reporting.
Key Architecture Capabilities
- Production-hardened core
- High-performance architecture
- Advanced security layers
SQL
The fundamental language for querying and managing structured datasets.
Key Architecture Capabilities
- Production-hardened core
- High-performance architecture
- Advanced security layers
Apache Spark
A unified analytics engine for large-scale data processing and cluster computing.
Key Architecture Capabilities
- Production-hardened core
- High-performance architecture
- Advanced security layers
Deep Technology Insights
Actionable Data Storytelling
We convert noisy statistical database logs into dynamic, highly interpretable visual narratives targeting key operations metrics.
- Real-time corporate performance metric visualization
- Cohort-focused customer behavioral visual charting
- Simplified, non-technical dashboard layout systems
Rigorous A/B Testing & Insights
We run advanced statistical hypotheses experiments on your user traffic to scientifically determine conversion drivers.
- Bayesian conversion calculation systems
- Automated traffic splitting and isolation schemes
- Detailed, clean statistical confidence reporting engines
Real-Time KPI Alerting Pipelines
We orchestrate continuous streaming data analysis systems to capture anomalies and notify operations teams instantly.
- Continuous metric stream calculation pipelines
- Instant Slack, email, or webhook alarm integration
- Dynamic anomaly detection using machine-learning limits
Why Data Analysis
is the Right Choice
Actionable Insights
Dashboards that don't just show numbers, but tell you what to do next.
Data Centralization
A single source of truth for all your marketing, sales, and operations data.
Better ROI
Identify underperforming assets and reallocate budget to what's working.
Self-Service BI
Empower non-technical team members to explore data without needing a developer.
Built for High-Impact
Business Outcomes
Each technology choice is evaluated against your business constraints, product roadmap, and operational goals so the stack supports long-term maintainability as well as immediate delivery speed.
Perfect For These Scenarios
The Codegrin
Excellence Guarantee
Deep Domain Expertise
Over a decade of combined experience in complex digital ecosystems.
Agile & Transparent
Constant communication and weekly delivery milestones.
Quality Without Compromise
Every line of code is peer-reviewed and rigorously tested.